Model Selection
Model selection is the problem of choosing among several candidate models. In practice, the “best” model depends on the goal:
- If the goal is prediction, we usually care most about out-of-sample error.
- If the goal is interpretation, we often prefer a simpler model that still explains the data well.
- If the goal is inference, we may care about nested-model tests and coefficient stability.
The main tradeoff is between goodness of fit and model complexity. A model that is too simple may underfit, while a model that is too flexible may overfit.
AIC
Definition
The Akaike Information Criterion (AIC) is defined by
where is the number of estimated parameters and is the maximized likelihood.
The AIC is a likelihood-based model selection criterion. It rewards models that fit the data well through the likelihood term, but penalizes models with more parameters through the term.
Interpretation
Lower AIC values are better. A smaller AIC means the model achieves a better balance between fit and complexity.
What AIC is measuring:
- The fit term gets smaller when the model explains the observed data better.
- The penalty term increases with the number of parameters.
- The criterion is designed to estimate expected predictive performance, up to an additive constant.
Important points:
- AIC is only meaningful when comparing models fit to the same dataset.
- The absolute value of AIC is usually not important; the differences between models are what matter.
- AIC tends to prefer more flexible models than BIC because its complexity penalty is smaller.
Warning
AIC is not a hypothesis test, and it does not tell you whether a model is “true.” It is only a relative comparison between candidate models.
BIC
Definition
The Bayesian Information Criterion (BIC) is defined by
where is the number of estimated parameters, is the sample size, and is the maximized likelihood.
Like AIC, BIC trades off fit and complexity. The difference is that its complexity penalty grows like , which is typically larger than once is moderately large.
Interpretation
Lower BIC values are better. Compared with AIC, BIC penalizes additional parameters more strongly, so it tends to prefer smaller models.
Important points:
- BIC is only meaningful for comparing models fit on the same data.
- As with AIC, the absolute value is less important than the difference across candidate models.
- BIC is often favored when the goal is identifying a parsimonious explanatory model rather than maximizing predictive performance.
Rule of Thumb
If AIC and BIC disagree, AIC usually leans toward predictive performance, while BIC usually leans toward simpler models.
Cross-Validation
Definition
Cross-validation estimates out-of-sample performance by repeatedly splitting the available data into a training portion and a validation portion. The model is fit on the training data and evaluated on data that were not used for fitting.
The main reason to use cross-validation is that training error is often too optimistic. A model can fit the training data extremely well but generalize poorly to new data.
Holdout Validation
The simplest version is a single train-validation split:
- Split the data into a training set and a validation set.
- Fit each candidate model on the training set.
- Evaluate each model on the validation set using a prediction metric such as MSE.
- Choose the model with the best validation performance.
This method is simple but can be noisy, since the result depends on one random split.
K-Fold Cross-Validation
The most common version is -fold cross-validation:
- Split the data into roughly equal folds.
- For each fold, fit the model on the other folds.
- Evaluate the fitted model on the held-out fold.
- Average the validation error across all folds.
If the fold-specific errors are , then the cross-validation estimate is
Interpretation
Smaller cross-validation error is better. Among competing models, we usually prefer the one with the lowest estimated out-of-sample error.
Common choices are or .
Warning
Cross-validation is mainly for predictive assessment. It does not directly tell you whether a coefficient is statistically significant or whether the model assumptions are correct.
Log Loss
Definition
For binary classification with true labels and predicted probabilities , the log loss is
Log loss measures how good the predicted probabilities are, not just whether the final class prediction is correct.
Interpretation
Lower log loss is better. A model gets a small log loss when it assigns high probability to the true class, and a large log loss when it is confidently wrong.
Important points:
- Log loss uses the full predicted probability, so it is sensitive to calibration.
- Two classifiers can have the same accuracy but very different log loss values.
- Log loss is especially natural for models such as logistic regression, where it comes directly from the likelihood.
Warning
Log loss can become very large if the model assigns probability near 0 to the true class. This is why it strongly discourages overconfident wrong predictions.
ROC-AUC
Definition
The receiver operating characteristic (ROC) curve plots the true positive rate against the false positive rate as the classification threshold varies. The area under the ROC curve (ROC-AUC) is the area under this curve.
ROC-AUC measures how well a model ranks positive examples above negative examples across all possible thresholds.
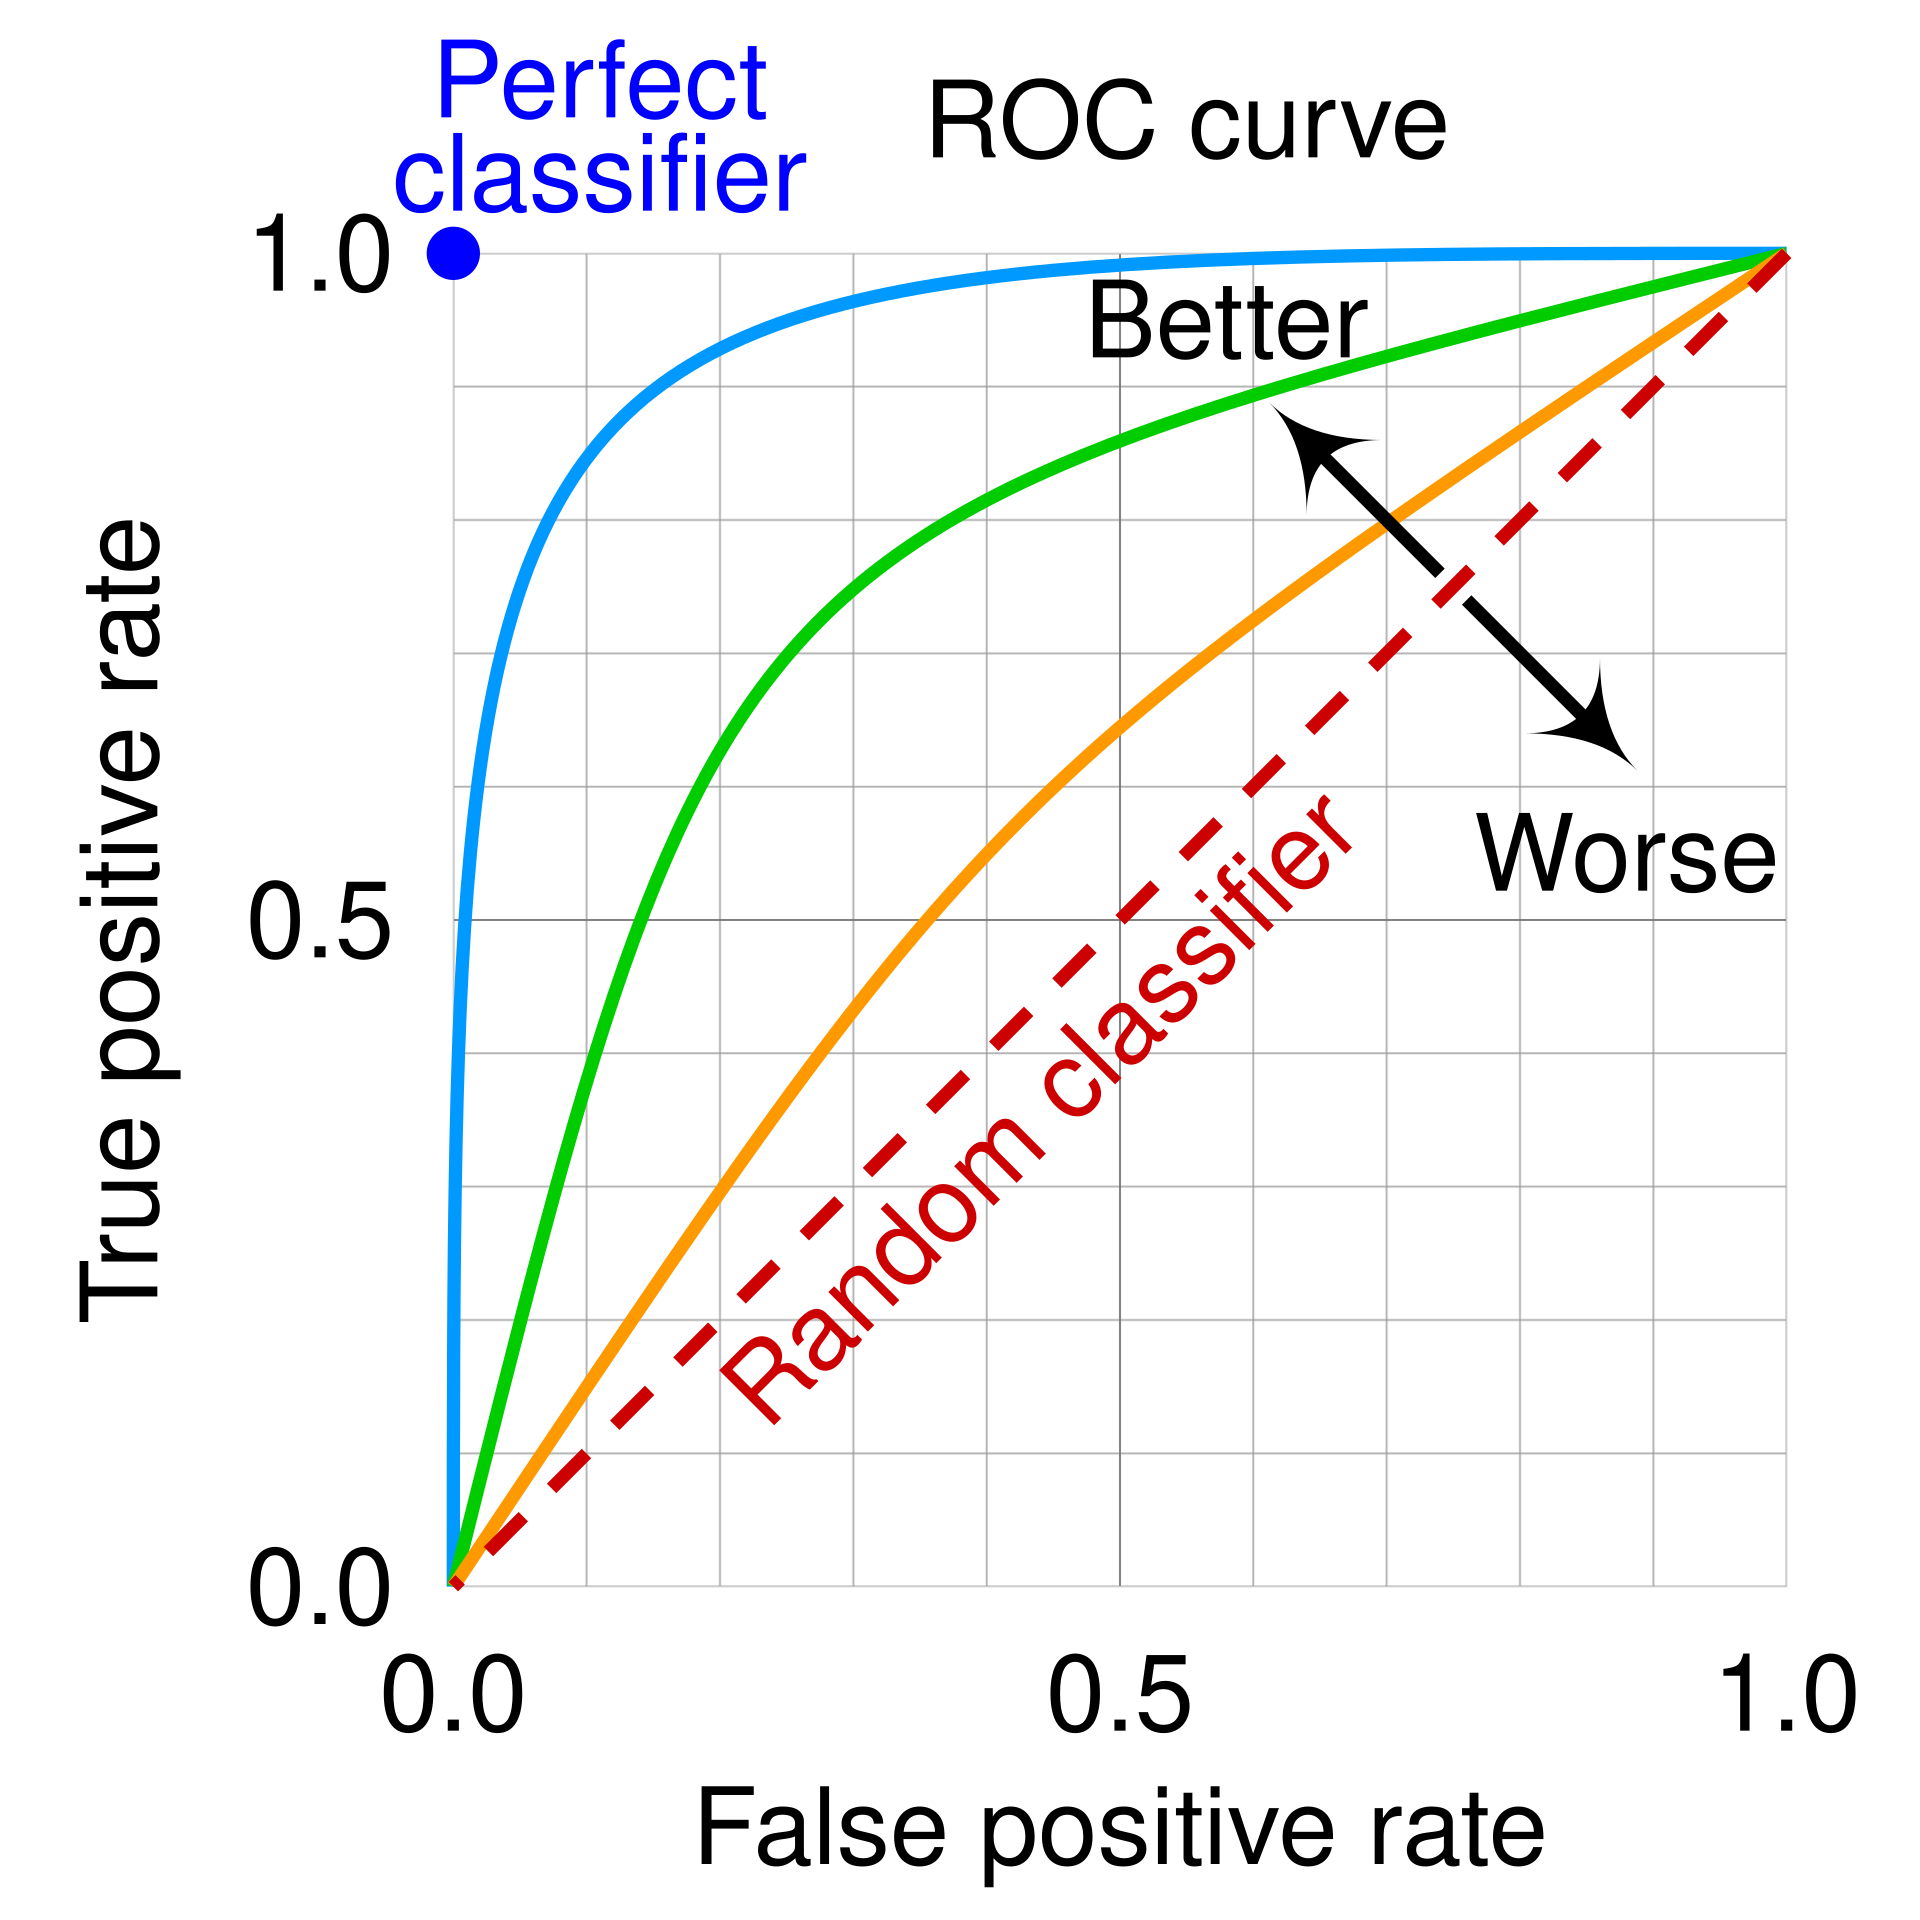
Interpretation
Larger ROC-AUC values are better.
- ROC-AUC = 1 means perfect ranking.
- ROC-AUC = 0.5 corresponds to random guessing.
- Values below 0.5 mean the ranking is worse than random, and reversing the scores would do better.
An equivalent probabilistic interpretation is that ROC-AUC is the probability that a randomly chosen positive example receives a higher score than a randomly chosen negative example.
Important points:
- ROC-AUC is threshold-independent, which makes it useful when you care about ranking quality rather than one fixed decision rule.
- ROC-AUC does not directly evaluate probability calibration.
- ROC-AUC can look overly optimistic on highly imbalanced datasets, because the false positive rate may remain small even when there are many false positives in absolute number.
PR-AUC
Definition
The precision-recall (PR) curve plots precision against recall as the classification threshold varies. The area under the precision-recall curve (PR-AUC) summarizes this curve in a single number.
PR-AUC is often more informative than ROC-AUC when the positive class is rare and we care strongly about finding positives without producing too many false alarms.
Interpretation
Larger PR-AUC values are better. A higher PR-AUC means the model can achieve better precision-recall tradeoffs over a range of thresholds.
Important points:
- PR-AUC focuses attention on the positive class.
- PR-AUC is often preferred over ROC-AUC for severe class imbalance.
- The baseline value depends on the prevalence of the positive class, so PR-AUC values are not interpreted as uniformly as ROC-AUC values.
Warning
PR-AUC is not as directly comparable across datasets with very different class balance, since the baseline changes with the proportion of positives.
Summary
These tools answer slightly different questions:
- AIC compares likelihood-based models with a mild complexity penalty and is often used when prediction is important.
- BIC compares likelihood-based models with a stronger complexity penalty and often prefers smaller models.
- Cross-validation directly estimates out-of-sample prediction error and is usually the most natural choice when prediction is the main goal.
- Log loss compares the quality of predicted probabilities.
- ROC-AUC compares ranking quality across thresholds.
- PR-AUC is often most informative when the positive class is rare.
Interview Summary
AIC and BIC are penalized-likelihood criteria, while cross-validation estimates generalization error directly. Log loss measures probability quality, ROC-AUC measures ranking quality, and PR-AUC is especially useful for imbalanced classification. Lower is better for log loss, while higher is better for ROC-AUC and PR-AUC.